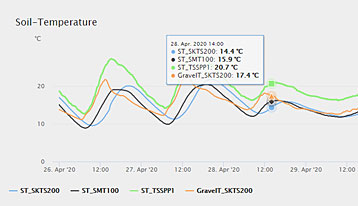

WebVIS guides you from the collection of your data to the evaluation and presentation. UP GmbH cares for the transmission and storage of your measurements and cover the preparation, conversion, evaluation and visualization of the data according to your requirements.


UP_CB_1 shows the data of a soil moisture- and soil temperature profile probe
together with precipitation data collected by a GP2 data logger. By clicking on "Axes auto scaled" you can see the high resolution
course of the measured values and the possibility to display two parameters (soil moisture + precipitation) in one graph.
To station UP_CB_1
The station Wetter_Ibb2 shows comparisons of different air humidity and air temperature sensors.
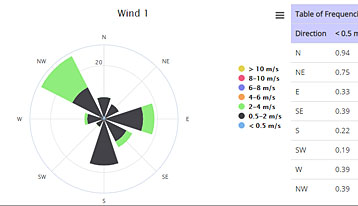
Under "Monthly trend" it is also possible to view the wind sensor evaluation in form of a wind rose.
If you test the menu bar, you can see in the "Monthly tables" for the respective month the daily average
(if necessary min/max) values per parameter in a table, which you can copy directly by mouse click, or export as csv- or
Excel file. Under "Information on the project" you will receive additional information on the sensors used,
measuring intervals, locations etc. for each station.
To station Wetter_Ibb2